One Console. Zero IT Whiplash.
Stop switching between consoles and manually correlating datasets. Traffic Insights gives network teams a single solution to quickly see and understand how network traffic is impacting the performance of the network elements they control. By automatically correlating flow and SNMP data with synthetic test data, Traffic Insights helps network teams quickly visualize how traffic is impacting experience—so they can resolve business-critical issues effectively.

Rapidly Identify and Understand Traffic on Your Network
Traffic Insights provides network teams with a detailed view of traffic running on the networks they manage. By collecting and correlating flow (NetFlow and IPFIX) data to generate a contextualized understanding of network performance, ThousandEyes enables network teams to zero in on specific traffic flows that are impacting digital experiences across the enterprise.
Correlated Flow and Synthetics
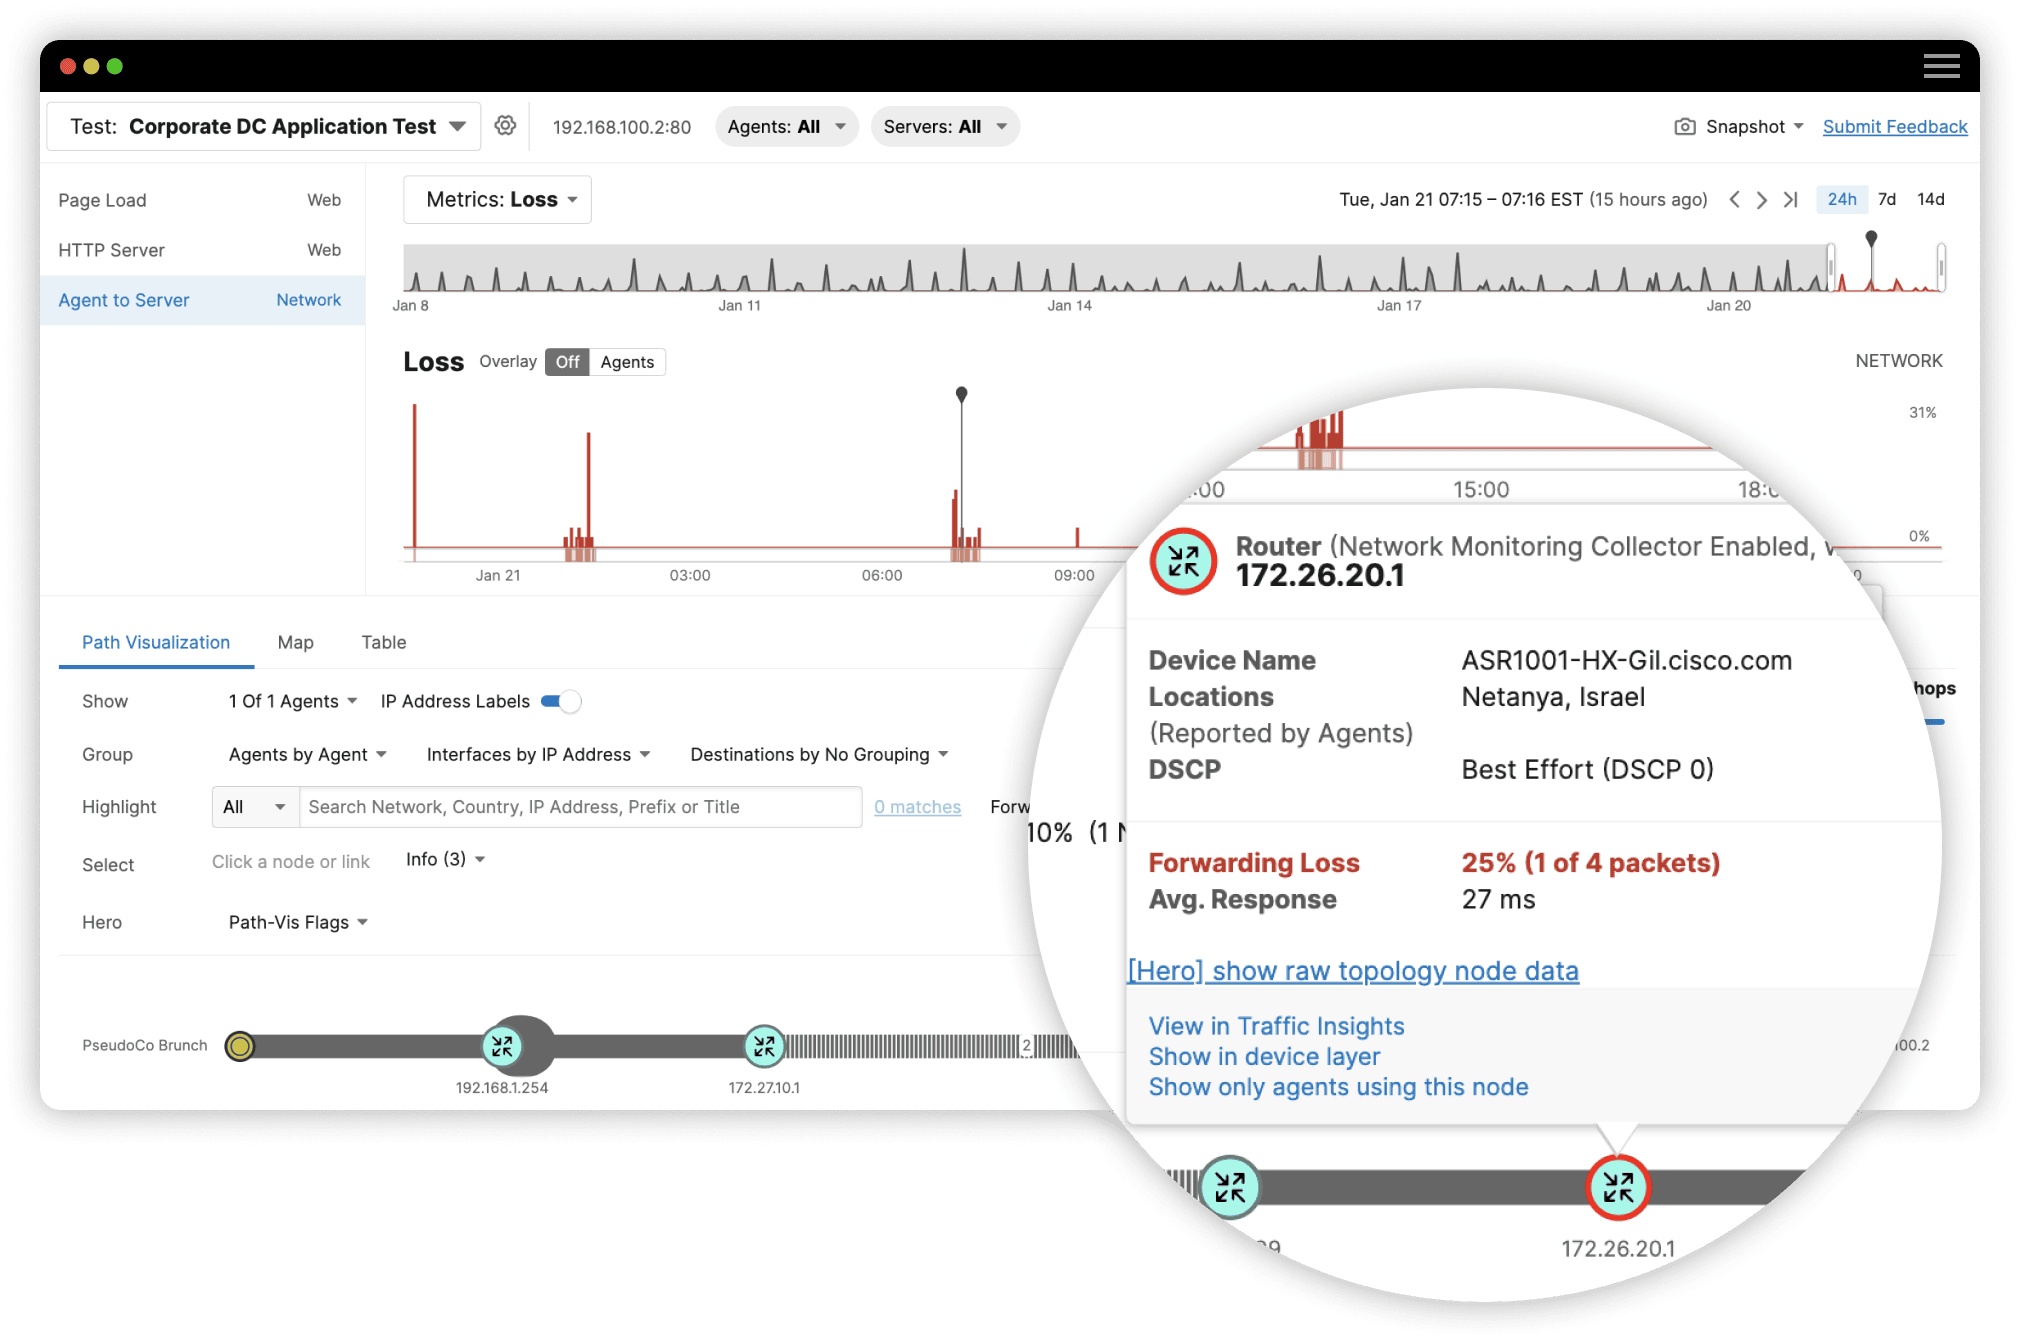
Leverage the unique power of the ThousandEyes platform to automatically correlate synthetic and flow data for rapid understanding and identification of root causes.
Powerful User Interface
Visually assess network usage trends and patterns to quickly zero in on traffic flows causing degraded performance across the enterprise network.
Scalable Visibility Across the Enterprise
Extend Traffic Insights to all critical locations with NetFlow and IPFIX supported on ThousandEyes Enterprise Agents, including those embedded in Cisco networking platforms.
Quickly See What’s Most Impactful
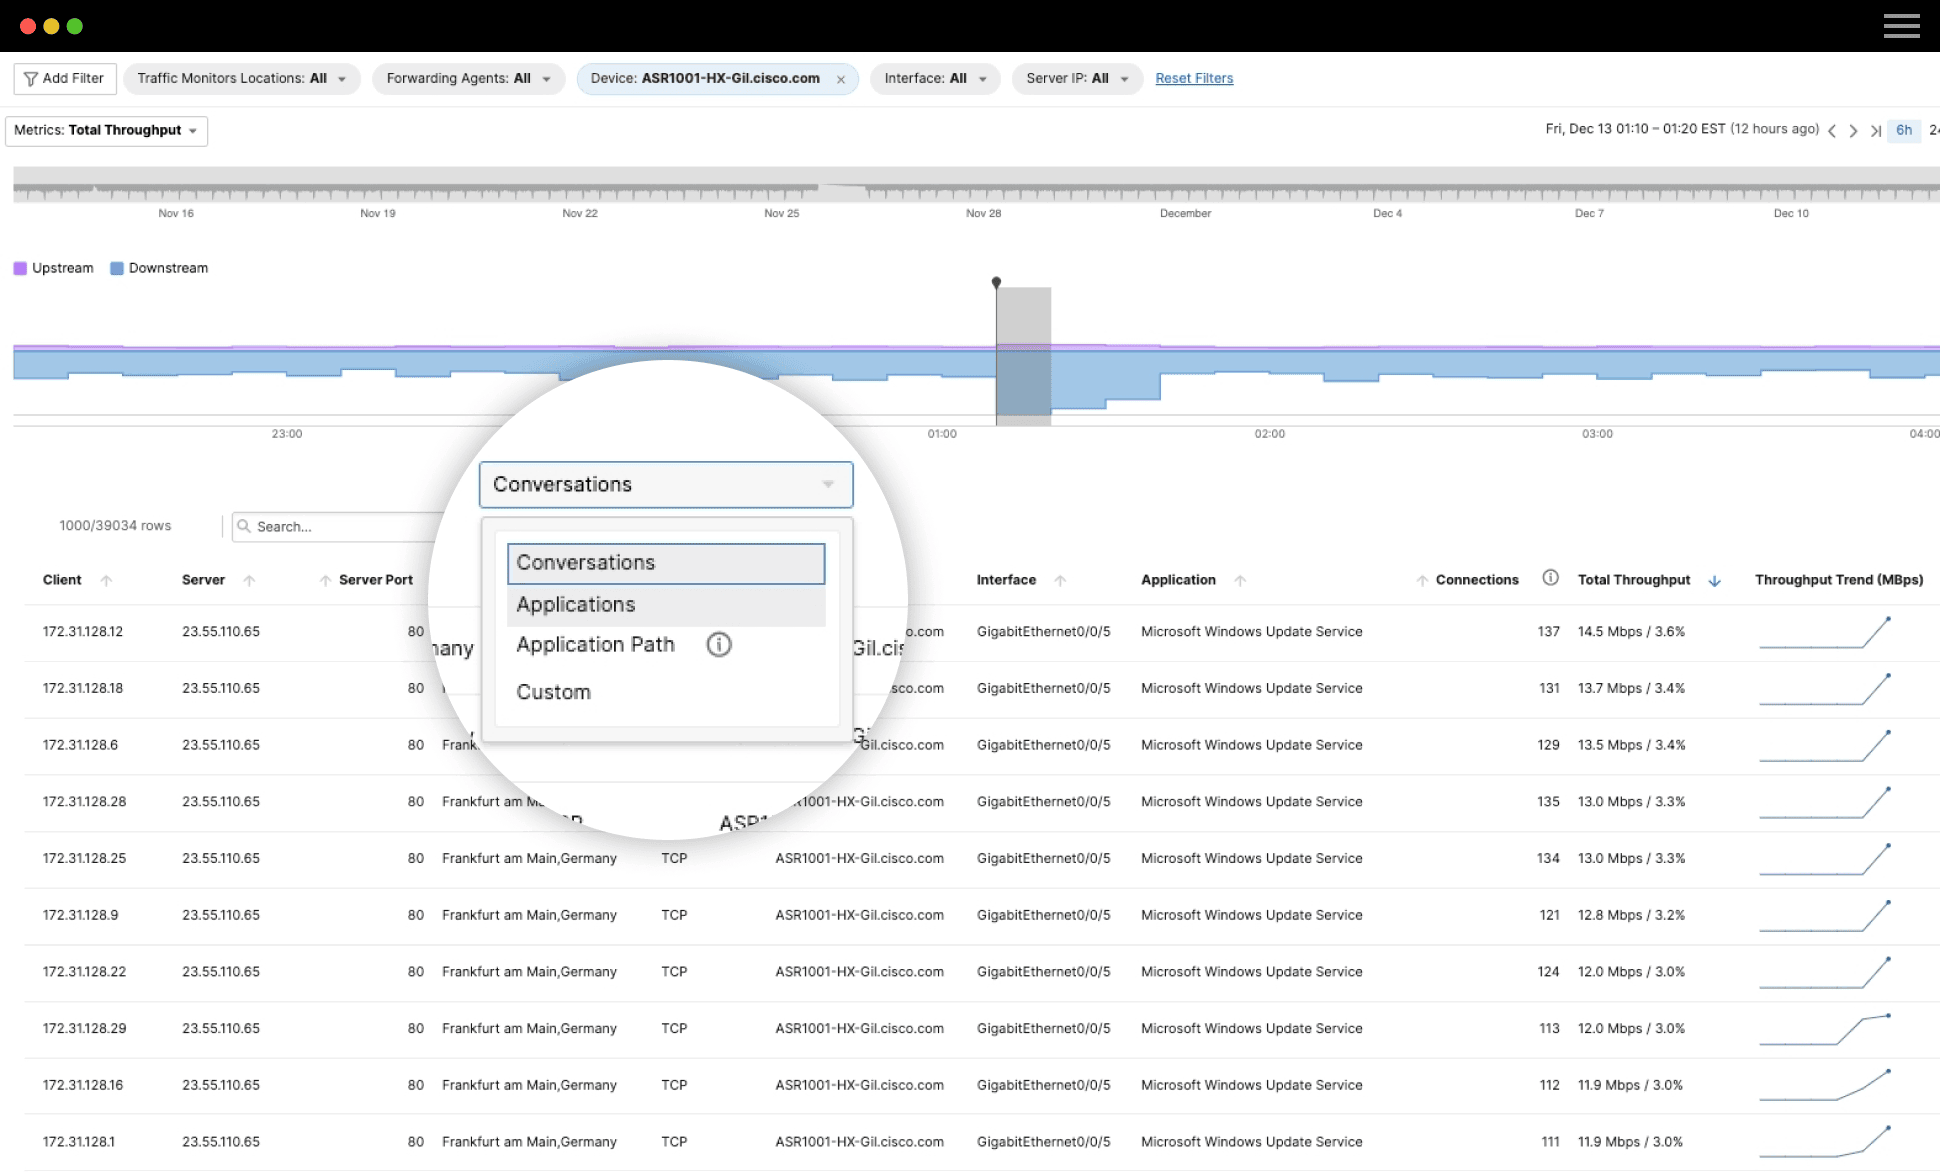
Traffic Insights enables network teams to identify which applications are running on the network, and parses flow records into detailed views over a sliding 30-day window. Network teams can focus on specific geographic locations, network devices or interfaces, and key traffic destinations, or they can view traffic grouped by conversation (source/destination IP), application, or application path to gain macro-level visibility into all of the traffic running across the enterprise. Custom dashboards provide summarized graphics that make it easy to understand trends and patterns.


Accelerate Remediation Through Simplified Workflows
Users can switch directly to the Traffic Insights view, pre-filtered to display only the traffic related to the underperforming node at the point in time shown in the path visualization. To identify and validate the root cause, Traffic Insights provides:
- Instant visibility into which traffic affected the performance of that node at that point in time
- An easy-to-understand graphical timeline displaying throughput or connections per second on that node
- The ability to group flow records to quickly identify which traffic caused the issue by application, conversation, or application path
- The ability to verify changes in traffic before, during, and after an incident occurs
See Traffic Insights in Action
This demo provides an overview of ThousandEyes Traffic Insights.
Featured Resources

Traffic Insights Overview

Traffic Insights Feature Update
Experience the power of ThousandEyes Traffic Insights firsthand.