If you’ve ever suffered from a large-scale outage and not known where to turn for reliable updates and information, you’re not alone. Today’s launch of Internet Outage Detection marks the culmination of months of hard work, and we’re excited to share a range of new features that harnesses the power of data aggregated from our entire user base to provide insights in the face of an outage. You’ll be well equipped to diagnose issues and make quick, well-informed decisions while you’re fighting network fires.
Internet Outage Detection has two parts:
- Traffic Outage Detection catches network outages occurring in Internet service providers (ISPs), provides information about specific failure points in the network path and quantifies the magnitude of both local and global impacts.
- Routing Outage Detection detects routing outages based on prefix reachability and shows details on both the scope of the outage and its likely root cause.
In this post, we’ll focus on the mechanics behind Traffic Outage Detection and a few interesting examples of network outages that triggered our algorithms. To see more about Routing Outage Detection, read our companion post.
Behind the Scenes: Traffic Outage Detection
To power the algorithms behind Traffic Outage Detection, we aggregate anonymized, real-time network data from all running ThousandEyes tests across our entire user base. Specifically, Traffic Outage Detection aggregates events where path traces terminate (i.e., where 100% of packets are dropped) in the same network. Outages are detected based on thresholds set on the number of these terminal instances.
At this time, an ‘Outage Detected’ dropdown will appear — together with the details provided at specific affected interfaces in the Path Visualization, you’ll get a good understanding of the severity and breadth of the traffic outage. Let’s dig into some examples from recent outages to see Traffic Outage Detection in action.
Failure Points in Telia’s Network in Ashburn
On July 17, 2016, we began seeing widespread issues in Telia’s network, particularly in Ashburn, VA. The traffic outage detected in Telia had a very wide scope, affecting several hundred tests across the ThousandEyes user base. As we explore this event, feel free to dig into the data at this share link.
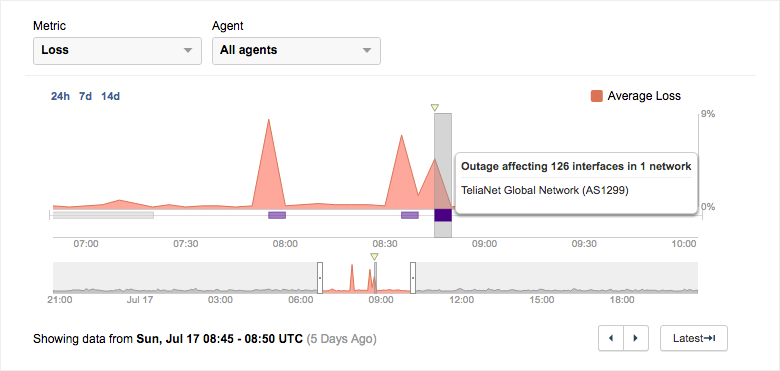
One of the affected tests targeted Skype’s login page. During the outage (marked in purple), the test observed several spikes in average packet loss, peaking at 8.5%.
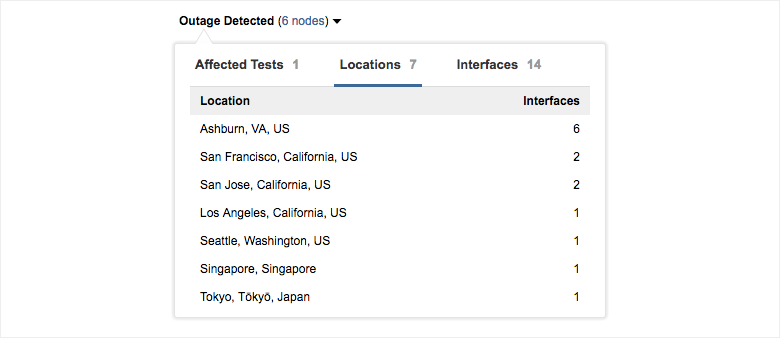
The ‘Outage Detected’ dropdown displays valuable information about the scale of the outage. We see that the Telia outage affected 36 tests in the current account group, including tests to multiple Salesforce, Microsoft Dynamics and Office 365 endpoints, all traversing a high number of affected interfaces.
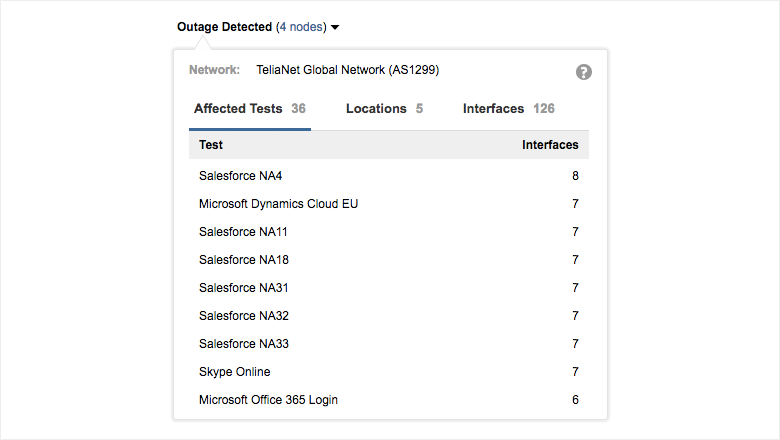
We can also get an idea of the global scope of the Telia outage. From the list of affected locations and interfaces across all ThousandEyes users, we see that the vast majority of affected interfaces are located in Ashburn, VA. It’s clear from the lists of affected locations and affected interfaces’ hostnames that Ashburn is ground zero for this outage.

that Ashburn is ground zero for the Telia outage.
Examining the Path Visualization, we see that path traces from only two Cloud Agents in the Midwest are affected, as these paths are the only ones that traverse Telia’s network in Ashburn to get to the destination in Luxembourg. Though the geographic scope of the outage is limited, the issues experienced by traffic traveling through Ashburn are severe: 100% of tests traveling through any of the three affected interfaces observe issues.
Because there are multiple path traces sent per test interval, there may still be a portion of path traces that successfully make it past the affected node, even when 100% of tests are affected, as is the case at the affected interface shown in detail below. At this interface, 58 tests across the ThousandEyes platform are affected there, two of which are in the current account group. In this case, the outage impacts a wide range of services, not just Skype.

Looking at the routing layer, we see that no route changes occurred during the Telia outage. This is confirmed by the fact that the networks traversed by the path of the two Midwestern agents don’t change during the outage. We can see this easily by comparing the path during the outage with the paths taken before and after. Blue nodes indicate nodes that stayed the same throughout, and it’s clear that the hop-by-hop path is almost exactly the same.
The node shown in detail is the same affected node we examined before; the original traffic path shows an additional two interfaces in Telia’s network in Ashburn in the subsequent hops. This indicates that the affected interface is firmly within the confines of Telia’s network. Together with the fact that both traffic paths and routes do not change, and that all three of the affected interfaces are similarly located within Telia’s network infrastructure, it’s clear that the most likely root cause is a failure in Telia’s network, perhaps an issue in physical infrastructure like a cable or interface, or the result of an internal routing or software misconfiguration.
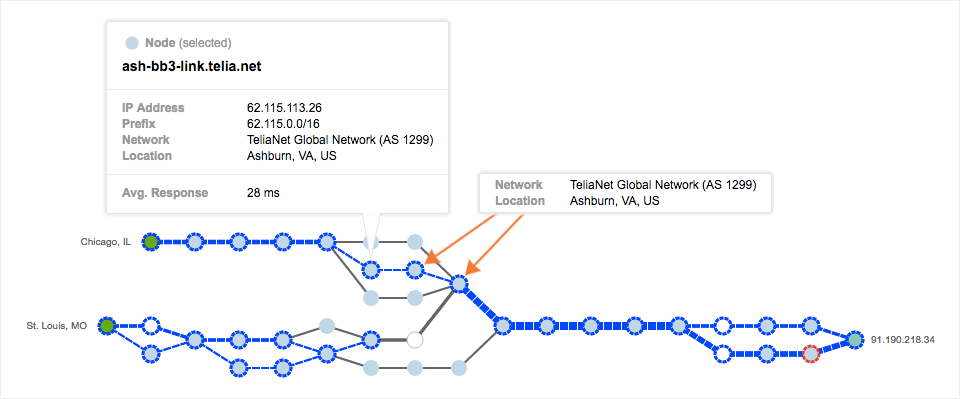
within Telia’s network, indicating that the most likely root cause is a failure within Telia’s network.
JIRA Outage: 0% Availability and Mysterious Path Changes
Another outage that we recently observed on July 10, 2016 brought down JIRA, a major SaaS service developed by Atlassian and used here at ThousandEyes. In contrast to the Telia outage, this outage only affected a handful of other tests and is considerably more complex, involving problems with multiple ISPs in both the network and routing layers. Visit the share link to see the data.
At first glance, it’s clear that there’s a huge problem: for about an hour, JIRA was completely down with 0% availability and 100% packet loss.
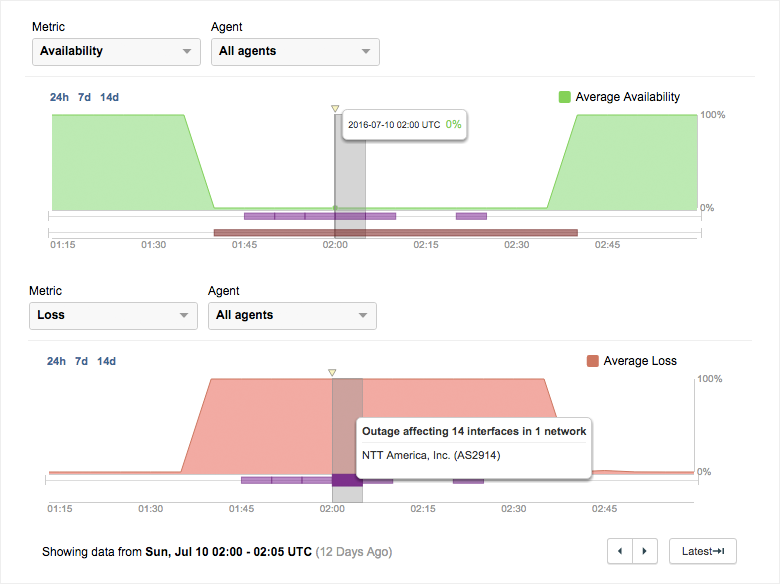
So what’s going on? A traffic outage was detected in NTT America, with the most affected interfaces located in Ashburn, yet again.
In the Path Visualization, we see that the six affected nodes (outlined in red) are all located, unsurprisingly, in NTT’s network in Ashburn. The scope of the outage is also limited — only this test to JIRA is affected at these interfaces. Loss Frequency is an indicator of how stable or noisy an interface has been over time; in this case, a medium loss frequency indicates that the interface has been somewhat stable over time. But given the severity of the issues at these interfaces, we need to look for more information regardless of the interfaces’ loss frequency.

Only this test to JIRA is affected at these interfaces across the ThousandEyes platform.
Now the question is of root cause—are we seeing issues due to routing issues and changing paths? During the outage, we see all paths entering and then terminating in NTT’s network. But the paths both before and after the outage show a different picture, with the majority of paths traveling through Level 3 and a minority through NTT.

those taken during, with paths traveling through both Level 3 and NTT.
Something fishy is certainly going on, with significant changes in traffic paths coinciding with critical performance issues. To answer the question of root cause, we need to consult data from the routing layer. If you’d like to go on to solve the mystery of JIRA’s outage, read our companion post about Routing Outage Detection.
All of the above tests are shared for free with ThousandEyes users on an ongoing basis. To try out Internet Outage Detection for yourself, sign up for a free trial of ThousandEyes today.