


This is the Internet Report: Pulse Update, where we analyze outages and trends across the Internet, from the previous two weeks, through the lens of ThousandEyes Internet and Cloud Intelligence. I’ll be here every other week, sharing the latest outage numbers and highlighting a few interesting outages. As always, you can read the full analysis below or tune in to the podcast for first-hand commentary.
Internet Outages & Trends
You settle down at your desk, fire up your computer, and launch an application, but something seems wrong. Part of the app loads, but it doesn’t appear to be working properly.
Application issues often show up like this. The service is reachable but unresponsive, rendering a basic landing page and, sometimes, an accompanying error message. It’s like a building that has a front door, but there’s no house behind it.
To some extent, this may happen by design. In web application development, when the app is experiencing an error because one component or dependency failed to load, it’s preferable to allow users to load part or all of the UI or landing page instead of displaying a 4xx or 5xx error message in its place. This approach allows at least part of the app to continue functioning, whereas a 4xx or 5xx error message would prevent the page from loading or calling other dependencies.
Still, the strategy can raise questions for users of these web applications or services. They might assume that the app is working fine when it initially loads and then be confused when they encounter glitches. In turn, because the app appears available to some extent, IT teams may have difficulty determining the source of the issues to resolve the problem or determine a workaround.
However, just because some parts of an app are available doesn’t mean the entire thing is actually functional. We saw this play out a number of times over the past few weeks.
Read on to learn about these incidents and other recent outage trends, or use the links below to jump to the sections that most interest you.
Reachable UIs, Unreachable Backends
CBA Outage
On June 26, CBA—one of Australia’s largest banks—experienced a near full-day outage of its digital properties, such as online banking. The problems reportedly left customers unable to transact or even view their bank balances, which displayed as zero dollars in many reported instances.
During the outage, the landing page of CBA’s websites and apps appeared to still render, but users faced excessive wait times when trying to call information from the backend systems sitting behind the UI. From ThousandEyes’ vantage point, it appeared that a connectivity issue within the bank’s backend left its web and mobile apps seemingly unable to call or display account data, and payments were knocked back as a result.
The bank hasn’t provided an official explanation for the issues as of the writing of this analysis, but they may release a statement in the future. We’ll monitor the space and provide future updates if they materialize.
Microsoft Teams Outage
In another example of an application being reachable but not fully functional, some Microsoft Teams users experienced an outage on June 28 when a reported configuration change to the Microsoft Teams collaboration platform caused users to be shown a message that read “Operation failed with unexpected error.”
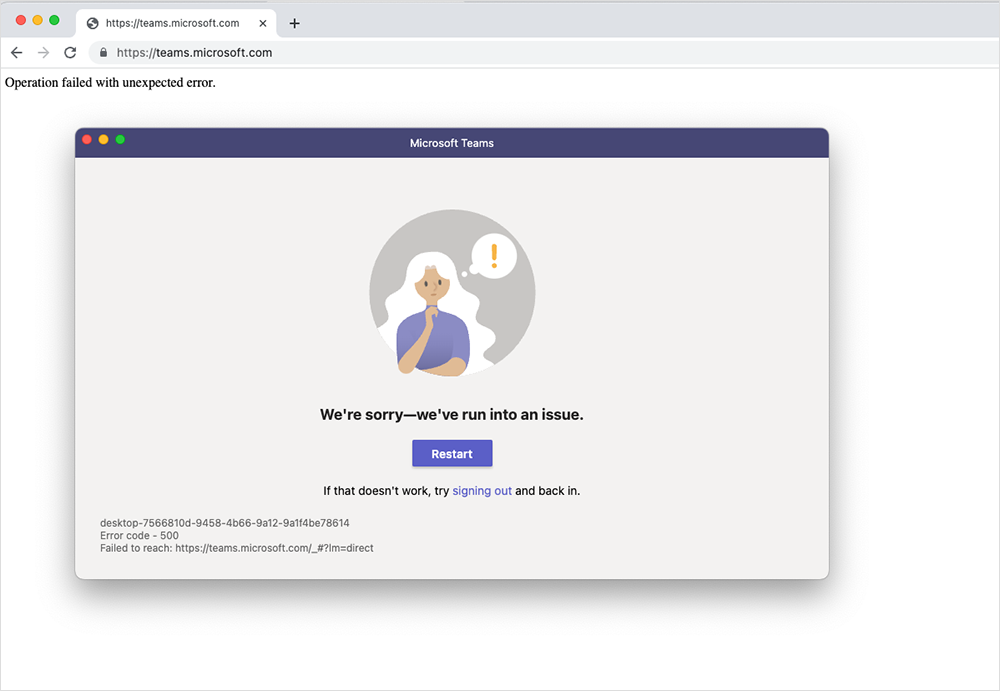
During the outage, users could still reach the frontend of the Teams app, but it appears they were unable to do anything beyond that point. This was apparent when viewing page load times in the ThousandEyes platform.

When the observed page load time for a web app drops below its usual levels, it can indicate that part of the page is still loading, but other parts are failing. For example—and this is hypothetical, not related specifically to Teams—if page load time is normally 2-2.5 seconds, and suddenly drops to 50 milliseconds, it could mean that some but not all of the page is loading. It may be that in the page’s normal operation, 20 objects need to load. If only one object loads, the page will still partially display, but it will just return errors when trying to execute requests or calls for additional information and objects. Something like this might explain what happened with Teams.
One of the curious aspects of this outage is that it appeared to only impact Teams, and not any of the other apps in the broader Microsoft 365 suite. That suggests that whatever configuration change Microsoft pushed through was specifically targeted at Teams. The nature of the change remains unclear. It might have been a bug fix, planned optimization, or feature tweak. ThousandEyes observed the cascading impact of the change as it propagated worldwide, with more and more locations impacted by the outage. The rollback of the change was also very visible, as Microsoft brought the hour-and-a-half long outage to an end.
GitHub Outage
Finally, there was a third case of the frontend loading but backend failing when GitHub users experienced a nearly 45-minute disruption on June 29. In this case, GitHub’s landing page rendered normally, but the backend service, system, or products the user was trying to run from the GitHub page just weren’t reachable.

GitHub offered this explanation of the root cause: Essentially, the company was testing a new failover mechanism that “had a network pathing configuration issue that prevented it from properly functioning as the primary facility. This caused issues with Internet connectivity to GitHub, ultimately resulting in an outage.” The company said it detected the problem quickly but that it took some time for traffic to rebalance and for operations to revert to normal.

UK Emergency Services Outage
In another instance of a failover mechanism failing, the UK’s emergency services calling system went down on June 25 and, according to reports, almost 11,500 calls were missed.
The system’s operator, BT, published a detailed post-incident report, explaining that the system backend comprises three clusters, what it calls a “triple resilient” network architecture. A fault in one cluster (it is unclear which cluster) led them to switch traffic to a backup system, but the call transfer process failed. They then tried to stand up one of the primary clusters to take the production workload, unknowingly choosing the faulty one.
The incident highlights a couple of recurring themes that we often discuss. First, there’s usually never a good time to run “live” tests for always-on, or mission-critical workloads, which can make discovering possible issues challenging. We often talk about this from the perspective of SaaS applications—with a global customer base, it’s always someone’s business day, and someone will always be inconvenienced. In this case, the UK's emergency services calling system also faced challenges with live tests. The emergency 999 line is a critical service and can’t afford to be offline for tests. For this reason, always-on services like this need to have robust plans and failsafes in place to address unexpected issues they aren’t able to test for ahead of time.
Despite the barriers to “live” testing, the system’s operator may decide there are some extra tests they can write to help diagnose potential problems in its primary clusters more accurately and gain additional visibility. For example, a test that recognizes excessive wait times, or a SIP call that emulates the dial-in experience of a user seeking emergency services’ assistance (which would typically be over a PSTN or cellular network), could both help identify the presence of a similar kind of issue.
However, it must be acknowledged that it’s impossible to anticipate every edge case and, furthermore, building a system that can handle every extreme scenario is simply not viable. It would be cost-prohibitive as well as impractical. That’s part of the reason why having response plans prepared in case something unexpectedly goes wrong is important—as well as having the visibility you need to quickly identify the source of a problem.
By the Numbers
In addition to the outages highlighted above, let’s close by taking a look at some of the global trends we observed across ISPs, cloud service provider networks, collaboration app networks, and edge networks over the past several weeks:
- Looking at total outages in the month of June, we see that global outages dropped from 1305 to 710, a 46% decrease when compared to May. This pattern was reflected in the U.S., with outages dropping from 597 to 310, a 48% decrease. This downward trend reflects patterns observed in previous years leading into the northern hemisphere summer.
- However, looking at outage fluctuations week over week, both global and U.S. outage numbers were reasonably stable throughout the entire month of June. Outage numbers didn’t swing dramatically during the month.
- June also saw a continued trend of U.S.-centric outage numbers accounting for at least 40% of all observed outages in a given fortnight. U.S. outages didn’t reach such high numbers earlier in the year, but since April, U.S.-centric outages have been 40% or more of observed outages. This percentage did decrease a bit throughout June, but it still never dipped below 40%. From May 22 - June 4, U.S.-centric outages accounted for 47% of all observed outages. This percentage dropped to 44% in the following two-week period (June 5-18) and then fell to 41% the next (June 19 - July 2).

