The adoption of cloud-based audio and video conferencing has been on the rise over the past few years. Positioned as a market leader by Gartner in the 2017 Magic Quadrant for Meeting Solutions, Cisco Webex is the goto conferencing service for enterprises globally. Cisco Webex solutions are delivered as a service over the Internet, a best effort network that has no performance guarantees. While Webex is a mature cloud solution, optimized for internet delivery, it is not exempt from the unpredictability and vagaries of the Internet. It is not uncommon to hear disgruntled employees complaining about connectivity issues to collaboration services like Webex due to glitchy meetings or poor voice quality. For corporate IT and network teams managing cloud-applications like Webex, it is challenging to troubleshoot performance issues as most of the infrastructure elements required in consuming Webex maybe outside the enterprise.
Cloud-based conferencing tools can turn an enterprise into a productivity powerhouse, but only if rightfully managed and monitored. Legacy network monitoring tools are no longer suitable for this Internet-centric, multi-communication environment, because they are siloed and primarily collect passive data from on-premises infrastructure. With cloud-based services like Webex, you might not own the application or most of the infrastructure, but you are still responsible for solving those pesky issues employees complain about. Ultimately, you need operational monitoring, reporting and fault isolation beyond the four walls of the enterprise.
Webex’ multi-tiered architecture and multiple communication call flows add yet another layer of complexity to troubleshooting. While Cisco Webex seamlessly integrates web, voice and video applications into a single interface that is easy to navigate and use, it involves a series of ‘behind-the-scenes’ inter-meshed communication to various endpoints, media servers and SIP gateways. All these segments of communication need to work together smoothly for a flawless end-user experience. In today’s blog post we will discuss the intricacies and dependencies while managing a SaaS collaboration application like Webex and best practices for performance monitoring and root cause detection.
The Webex Architecture and its Impact on Performance Monitoring
While Webex is a cloud service that is delivered through the Internet, it is hosted in Cisco owned data centers, collectively known as the Webex Collaboration Cloud. The Webex Cloud hosts geographically distributed data centers that are stitched together through dedicated links bypassing the Internet. Every enterprise that subscribes to Webex, is allocated an instance that is hosted within the Webex Cloud, geographically load-balanced between a primary and secondary data center. Your Webex instance can move between the two data centers and that movement is completely transparent from the end-users perspective.
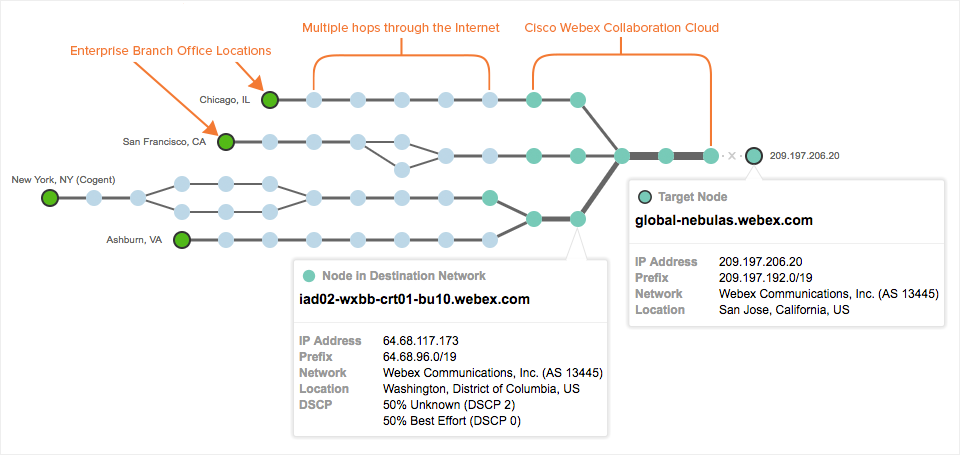
Figure 1 below represents the network topology from multiple locations to the ThousandEyes instance of Webex. The green nodes closer to the destination represent the Cisco Webex Collaboration Cloud. At the time of this capture, the ThousandEyes Webex instance thousandeyes.webex.com was located in the SJC data center, but is load-balanced with the Webex data center in DFW.

to the ThousandEyes Webex instance located in the Webex Cloud.
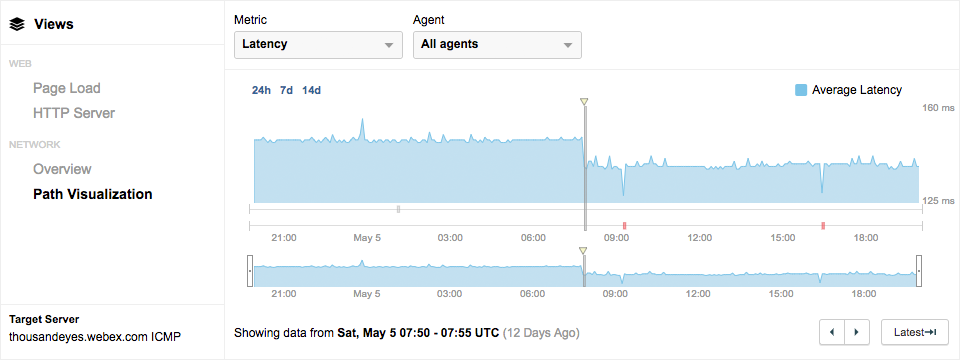
Depending on from where your enterprise users connect and to which data center, can impact network latency, number of ISP hops traversed and overall performance. For example, let’s take a look at Figure 2. The timeline represents network latency measurements from various global locations to the ThousandEyes Webex instance. The dip in latency on the timeline below corresponds directly to the switch in the data centers.

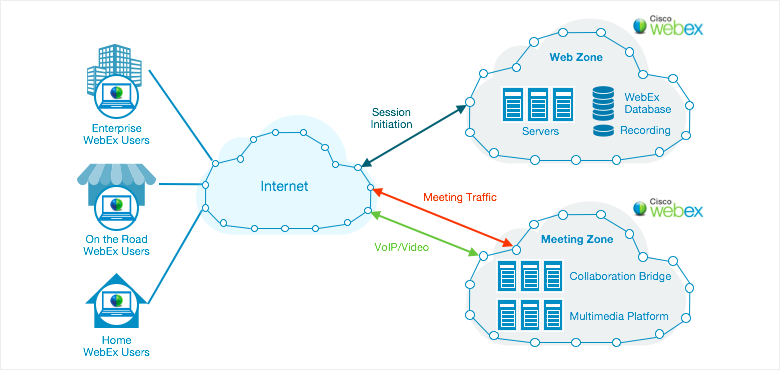
Each Webex data center is logically separated into zones—a Web Zone and a Meeting Zone. The Web Zone is responsible for things that happen before and after a meeting—like scheduling, user management and billing. The Web Zone for a Webex instance is located within the parent primary or second data center. The Meeting Zone is responsible for switching the actual meeting once it is in progress between the endpoints. Within the meeting zone, there are collaboration bridges that can do the switching and the multimedia platform is responsible for mixing all the VoIP and video streams.

The most important distinction here is that while the Web Zone for an instance is always located in the primary data center, the Meeting Zone data center is the one that is closest to the end user. What this translates to is that for the duration of a Webex call, there can possibly be multiple call flows comprising different traffic types to different application server endpoints. For example, when you schedule a Webex meeting, session initiation traffic is sent to the Web Zone, but when a call is in progress, audio and video traffic is directed to the collaboration, control and media servers in a completely different location. Cisco does a great job of seamlessly integrating these different flows, which means from an end-user perspective all of the backend chatter is transparent. But, for an IT team managing Webex and responsible for performance, it means having visibility and insight into multiple streams and endpoints is easier said than done!
Webex Monitoring Recommendations
So, what are some of the key considerations while monitoring Webex? In this section, I will outline some basic monitoring principles to be aware of when migrating to or utilizing Webex.
Identify and Monitor Key Dependencies - Internet Transit, DNS, VoIP or UCaaS
When you rely on a SaaS application, you are inevitably relying on multiple external services that you don’t directly own or control. These dependencies include ISPs, DNS and cloud-based UC solutions (while using Webex Voice). Cisco’s data centers are located near major Internet access points to route meeting traffic around the globe securely and reliable, however, that does not exclude the Internet from being a large part of the underlying transit (as seen in Figure 1). DNS is another critical piece of the internet delivery service chain, and one that enterprises cannot directly control. For instance, knowing if DNS is the root cause of your Webex connectivity issues can steer your troubleshooting efforts in the right direction.
Monitor All Webex Interactions
As we discussed previously, Webex has a complicated backend architecture. There are multiple call flows that occur simultaneously to different types of applications. Monitor not just your Webex instance located in a primary data center, but also connectivity to the collaboration and media servers, that might be a completely different data center. And because every one of your user locations will be taking a different path to get to the Meeting Zone data centers, there may be significant variation in performance.
Gain Visibility into Webex Service Delivery
To gain end-to-end performance data into Webex delivery, you need external visibility at both network and application layers. You can use a combination of different ThousandEyes vantage points that is best suited for your environment and use case. ThousandEyes uses an active monitoring methodology to gain performance insights, and since test traffic from our agents are indistinguishable from actual user traffic at Webex application servers, you will get an accurate measurement of user performance and network path.
- Leverage Cloud Agents (instantly available from 152 cities globally) to measure the user experience from various locations. Cloud Agents can be used as a way to benchmark performance and compare against various customer global branch offices.
- Deploy Enterprise Agents in your corporate network, within your data centers and regional branch offices to simulate your employee connectivity and performance.
- Endpoint Agents deployed on end-user laptops and desktops give you the most complete visibility into employee connectivity. To monitor Webex, distribute Endpoint Agents to a community of critical users to monitor page load metrics, network path, performance of DNS servers and even local WiFi connectivity.
ThousandEyes Tests are crafted to gain visibility into multiple dependencies and different components that affect performance. For example, an HTTP server test in the ThousandEyes application will provide application layer data (e.g., DNS and wait times), network topology visualization and hop-by-hop metrics such as packet loss, latency, and jitter along with insights into BGP AS hops. Having visibility into all of these components helps triangulate root cause within minutes and helps steer your troubleshooting and escalation processes in the right direction.
For example, in Figure 4 below, you can immediately attribute the dip in HTTP availability to a DNS resolution issue. As Webex is a SaaS service, the authoritative servers most likely belong to Cisco and not something you can directly control and fix. But access to this type of visibility data gives you the evidence required to escalate to the right channels and work towards resolution.

For your convenience, we compiled a set of ThousandEyes Tests that provides a comprehensive view of Webex performance.

The key to achieving a good user experience for your Webex users and getting ahead of change is to get visibility early, so you can define success metrics, get to know your providers, and have the data you need to get to root cause quickly. ThousandEyes advocates a continuous lifecycle approach to monitoring, including a readiness phase that will ensure issues are uncovered early, before impacting users.
Ensuring an excellent user experience for any SaaS application is challenging—because there’s no steady state in the cloud. But with application-aware network visibility into your external environment, you can successfully navigate the cloud and achieve SaaS success. Don’t wait anymore and start monitoring your Webex instance with a ThousandEyes free trial. Want to learn more from our experts? Request a demo.


